 | ||
EDUCATION & SCIENCE Teacher's Guide Protocols Student Investigations School Collaboration Scientists' Corner Educators' Corner GLOBE DATA GLOBE
PARTNERS LIBRARY INFO &
HELP | ||
 GLOBE Launches Student El Niņo Experiment
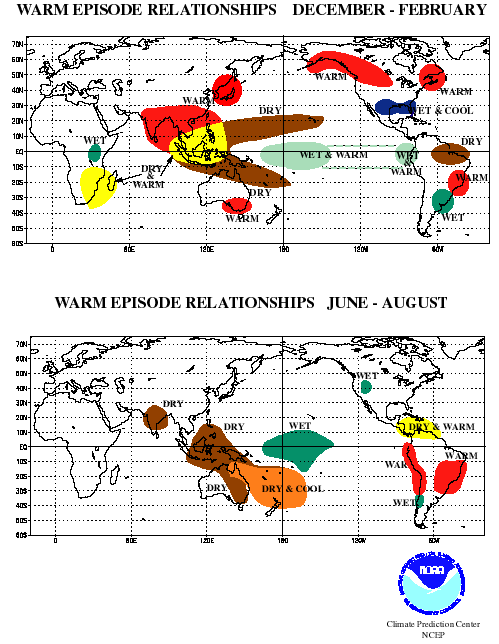
An El Niņo is occurring!For the first time since the GLOBE program began measuring the environment, an El Niņo is underway in the tropical Pacific. All early indications are that it is a big one! GLOBE students can help scientists study this important phenomena.What is an El Niņo?El Niņo is a major shift in the ocean-atmosphere system in the tropical Pacific. The atmosphere and oceans of our planet are always in motion, and these motions generally follow specific circulation patterns. In the equatorial Pacific Ocean, there are three patterns -- a normal pattern, an El Niņo or warm pattern, and a cold pattern sometimes called a La Niņa pattern. The warm and cold terms describe conditions in the eastern tropical Pacific Ocean. El Niņo patterns usually persist for one to two years.Using buoys, satellites, and island monitoring stations, scientists observed a shift to the El Niņo pattern beginning in April 1997. This shift is expected to affect the circulation patterns in other regions as well. Scientists call this overall phenomenon the El Niņo Southern Oscillation or ENSO for short. What are the effects of an El Niņo?The effects of an El Niņo event are first noticed in the countries near the equator bordering the Pacific ocean. For example, Ecuador experiences severe rains and flooding while much of northern Australia has a drought. After a few months, the regions affected grow to include the temperate zones, particularly the subtropics.Based on past ENSO events and on models of the circulation of the atmosphere and oceans, scientists are predicting abnormally wet, dry, warm, or cold conditions for different regions at different times. These predictions are really hypotheses that can be tested by observing what actually happens to air temperature, precipitation, soil moisture, and other environmental properties. The maps below show one set of predictions based on past events. Maps of historical data and model predictions also are available as special GLOBE visualizations.
 You can contribute to the first GLOBE El Niņo Experiment!GLOBE students can help test these predictions or hypotheses for their areas by taking GLOBE measurements faithfully and carefully during the coming months. Together, we can conduct the first GLOBE El Niņo Experiment! The predictions given in the maps above focus on temperature and moisture, so special effort should be devoted to your measurements of air, surface water, and soil temperature, solid and liquid precipitation, and soil moisture. Your other GLOBE measurements remain important as well and offer additional opportunities to help scientists understand the full effects of El Niņo. Remember that even if the predictions for your area are that there will be no effect, that is still a hypothesis you can test.If your school is new to GLOBE, this is a good reason to get going; the El Niņo will not wait. If your school already has been taking measurements, this is a great time to expand your measurements and to take data as frequently as requested in the current GLOBE II protocols. The GLOBE investigators, other scientists, and myself are all interested in the results and will work with you as our experiment proceeds. Suggested ActivitiesStudy the prediction maps, and determine the specific hypothesis of how El Niņo was predicted affect the climate in your area from December 1997 to February 1998. Develop a specific measurement plan that your school will follow in collecting measurements from now to March 1998 to test this hypothesis. Review any past data from your school or other data from near-by measurements to determine the monthly average temperatures and monthly total precipitation for the last two years. These data give you a basis with which to compare. Together, your school specific hypothesis, measurement plan, and historical data base provide the framework for your component in the first GLOBE El Niņo Experiment!All GLOBE schools have a chance to work together in this experiment. Select another GLOBE school in a different part of the world and determine the specific hypothesis for their area just as you did for your school. What data should they take to test the hypothesis for their location? Locate historic data for their school or area. Use GLOBEMail or other means to correspond with the school you have selected. If both schools are willing, you can share and compare your measurements as the El Niņo proceeds. Working together should help both schools to better understand what is happening globally as a result of El Niņo. More to comeWatch for more messages from scientists about El Niņo, additional maps showing different predictions for the months ahead, and new learning activities. Also look for reports from GLOBE schools about unusual environmental phenomena in their areas which may be related to ENSO.Languages :
Server locations : USA Questions/Comments regarding the GLOBE Program GLOBE is managed by UCAR/CSU with support from
NASA, NSF, the US Dept. of State, and other
cooperating organizations.
[ Privacy
][ Accessibility
][ Terms
of Use ] |


